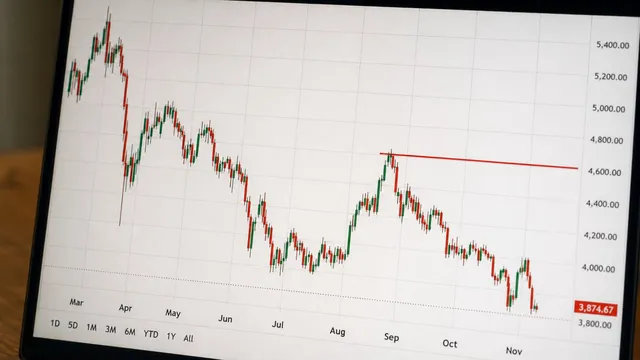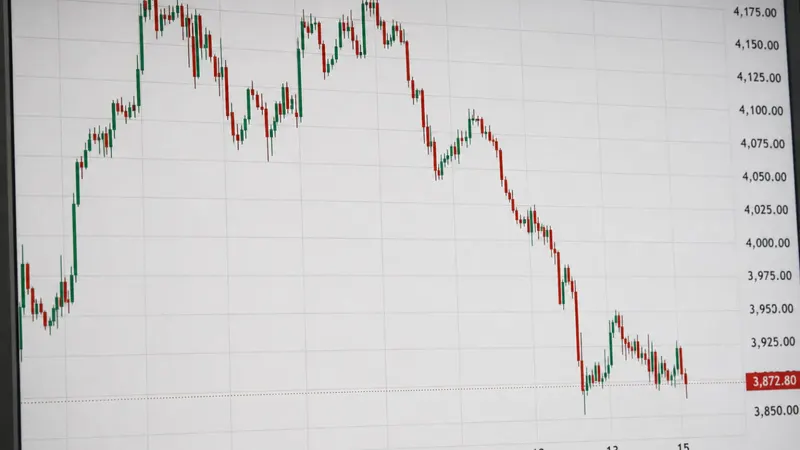

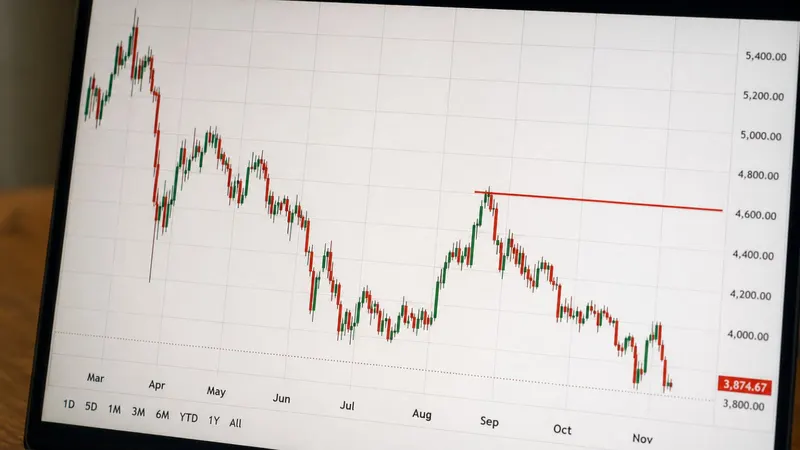
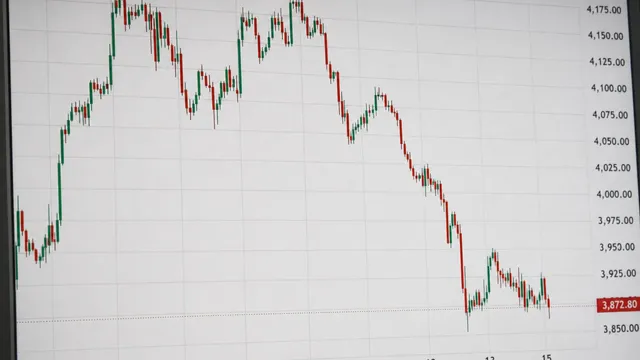
Gold falls near $3,876 as Fed speakers keep focus on inflation
Gold slipped in Asia as traders awaited Kevin Warsh’s AI comments and priced in another Fed rate increase in December.

XAUUSD price movements are closely monitored in the precious metals market. Investors and traders use live quotations to track fluctuations, identify trends, and evaluate market conditions. Understanding how gold is priced, what influences its value, and how to interpret charts provides a foundation for making informed decisions in a market shaped by global economic developments.
Top-rated brokers
Compare all 9 XMBest overall for gold CFDsGold spread0.25Visit XM (opens in a new tab)
 XTBGold CFDs and real gold ETFsGold spread0.35Visit XTB (opens in a new tab)
 PepperstoneMost regulatorsGold spread0.05Visit Pepperstone (opens in a new tab)
CFDs are complex instruments and come with a high risk of losing money rapidly due to leverage. You should consider whether you understand how CFDs work and whether you can afford to take the high risk of losing your money.

Chart by TradingView, OANDA feed. Indicative: check the quote on your own platform before you trade.
Latest news
All newsGold slipped in Asia as traders awaited Kevin Warsh’s AI comments and priced in another Fed rate increase in December.
Gold remains under pressure after hawkish Fed signals, stronger US CPI and dollar strength put focus on key XAU/USD levels.
Goldman Sachs lowered its end-2027 gold forecast as a longer Fed hiking cycle clouds private demand for bullion.
Nine brokers that offer gold against the US dollar as a CFD, with the gold spread, the deposit and the leverage side by side.
Figures indicative; verify with the broker and its regulator. Spreads, deposits and leverage change by account type and entity. CFDs are complex instruments and come with a high risk of losing money rapidly due to leverage. You should consider whether you understand how CFDs work and whether you can afford to take the high risk of losing your money.
Best for: Best overall for gold CFDs
CFDs are complex instruments and come with a high risk of losing money rapidly due to leverage. You should consider whether you understand how CFDs work and whether you can afford to take the high risk of losing your money.
Best for: Gold CFDs and real gold ETFs
CFDs are complex instruments and come with a high risk of losing money rapidly due to leverage. You should consider whether you understand how CFDs work and whether you can afford to take the high risk of losing your money.
Best for: Most regulators
CFDs are complex instruments and come with a high risk of losing money rapidly due to leverage. You should consider whether you understand how CFDs work and whether you can afford to take the high risk of losing your money.

Best for: Best for TradingView
CFDs are complex instruments and come with a high risk of losing money rapidly due to leverage. You should consider whether you understand how CFDs work and whether you can afford to take the high risk of losing your money.

Best for: Fixed-spread option
CFDs are complex instruments and come with a high risk of losing money rapidly due to leverage. You should consider whether you understand how CFDs work and whether you can afford to take the high risk of losing your money.

Best for: Gold CFDs and US futures
CFDs are complex instruments and come with a high risk of losing money rapidly due to leverage. You should consider whether you understand how CFDs work and whether you can afford to take the high risk of losing your money.

Best for: Easiest gold ETF access
CFDs are complex instruments and come with a high risk of losing money rapidly due to leverage. You should consider whether you understand how CFDs work and whether you can afford to take the high risk of losing your money.

Best for: Low entry point
CFDs are complex instruments and come with a high risk of losing money rapidly due to leverage. You should consider whether you understand how CFDs work and whether you can afford to take the high risk of losing your money.

Best for: Strong education
CFDs are complex instruments and come with a high risk of losing money rapidly due to leverage. You should consider whether you understand how CFDs work and whether you can afford to take the high risk of losing your money.
No broker matches every filter.
The reports, decisions and market moves behind the gold price, from the news desk.
Gold slipped in Asia as traders awaited Kevin Warsh’s AI comments and priced in another Fed rate increase in December.
Gold remains under pressure after hawkish Fed signals, stronger US CPI and dollar strength put focus on key XAU/USD levels.
Goldman Sachs lowered its end-2027 gold forecast as a longer Fed hiking cycle clouds private demand for bullion.
Silver hit its lowest level since November 2025 as a stronger US dollar and weak technical signals weighed on XAG/USD.
Danske Bank says solid US data and a hawkish Fed tone have lifted the dollar and pushed EUR/USD below 1.1030.
Kansas City Fed President Jeff Schmid said US inflation remains too high, while futures markets price in another December increase.
Monitoring the XAUUSD live price helps market participants understand how the value of gold changes throughout the trading day. Prices respond to economic announcements, currency fluctuations, investor demand, and changes in financial market sentiment.
The XAUUSD price represents the amount of US dollars required to purchase one troy ounce of gold. For example, a quotation of $4,000 would indicate that one troy ounce is valued at approximately $4,000 in the quoted market. This figure is illustrative rather than a current market quotation. Actual prices fluctuate as buyers and sellers respond to new information.
A reliable market display should show the latest quotation, its timestamp, and whether the feed represents spot gold or another instrument. When checking the current XAUUSD gold price, traders should also consider the daily change, session high, session low, and recent market direction. These figures provide context that a single quotation cannot communicate. A rising price may indicate stronger demand, but the significance of that movement depends on the surrounding market environment.
An XAU/USD live price feed receives pricing information from market data providers, liquidity sources, or trading venues. Updates may arrive continuously during active sessions, although the actual frequency depends on the data service. Some websites display indicative prices, while trading platforms may show executable bid and ask quotations from their own liquidity arrangements.
Searches for XAU/USD live price, XAUUSD price live, or XAU USD live price generally refer to the same underlying objective: finding an updated gold quotation expressed in dollars. However, these labels do not guarantee that every provider displays identical values. Users should check whether the information is delayed, how frequently it refreshes, and which market the quoted price represents before relying on it for decisions.
The bid is the price at which a dealer or liquidity provider is prepared to buy XAUUSD exposure, while the ask is the price at which it is prepared to sell. The difference between these quotations is the spread, an important transaction cost for traders. The spread can change as liquidity and market volatility fluctuate.
A displayed XAU USD price may represent the bid, ask, midpoint, or another reference quotation. This helps explain why different websites occasionally report slightly different values at the same moment. Traders comparing XAUUSD quotations should identify the quotation type and whether additional commissions apply. During unexpected announcements or periods of reduced liquidity, spreads may widen considerably, increasing the cost of entering or exiting positions.
An XAUUSD chart displays historical price activity and helps identify how market conditions develop over time. Charts provide more information than standalone quotations because they show direction, volatility, and how prices react around important technical levels.
XAUUSD candlestick charts are widely used for technical analysis because they summarize price movements over selected intervals. Each candle normally represents an opening price, closing price, highest price, and lowest price. Its body shows the relationship between opening and closing values, while the upper and lower wicks illustrate the extremes reached during that period.
An XAUUSD live chart may provide intervals ranging from one minute to several months. Shorter periods reveal intraday fluctuations, while daily and weekly charts offer a broader perspective on market trends. Traders should select intervals that match their objectives rather than relying on a single view. A movement that appears significant on a five-minute chart may represent only a minor fluctuation within a larger daily trend.
On an XAU/USD price chart, support refers to an area where buying interest has previously been strong enough to slow or reverse a decline. Resistance describes an area where selling pressure has repeatedly interrupted an upward movement. These levels can help traders interpret XAUUSD behavior, although neither provides a guaranteed turning point.
When examining an XAUUSD chart, analysts often identify previous highs, lows, consolidation areas, and psychological round numbers. Repeated reactions around a level may increase its relevance, but the surrounding economic environment also matters. A strong employment report or unexpected policy announcement can cause prices to move through an established technical area without producing the reversal that historical behavior might suggest.
Technical indicators transform historical market information into calculations designed to highlight trends, momentum, or volatility. Common examples include moving averages, the Relative Strength Index (RSI), Moving Average Convergence Divergence (MACD), and Average True Range (ATR). Each provides a different interpretation of price activity. An XAUUSD live display can pair an updated quotation with these historical calculations.
Moving averages may help identify directional trends, while RSI can indicate when recent buying or selling momentum has become unusually strong. ATR measures the size of recent price fluctuations without predicting direction. The XAU USD current price alone cannot establish momentum or future direction. XAUUSD indicators should be interpreted together with chart structure and economic conditions. Their calculations are based on past observations, so they may produce delayed signals or misleading readings when conditions change suddenly.
XAUUSD is a market symbol representing gold valued in US dollars. Understanding the structure of this quotation helps distinguish the precious metal’s market value from the prices offered through physical dealers, exchange-traded products, and leveraged trading platforms.

XAU is the ISO 4217 code used to identify gold, while USD represents the United States dollar. The XAU/USD notation expresses how many dollars correspond to one troy ounce of gold. Although it resembles a foreign exchange currency pair, the underlying asset is a precious metal rather than another national currency.
Market platforms may present the same general quotation using formats such as XAU USD or XAUUSD. These variations mainly reflect naming conventions rather than different underlying metals. Nevertheless, individual instruments may have different specifications. Traders should verify whether a symbol refers to spot pricing, a derivative, or another product before assuming that two similarly named instruments are interchangeable.
The XAU/USD price is quoted in US dollars per troy ounce. A troy ounce weighs approximately 31.1035 grams and is the standard weight unit underlying XAUUSD quotations and international precious metals pricing. This measurement differs from the ordinary avoirdupois ounce used for many consumer goods.
The XAU USD gold price reflects market conditions among institutions, dealers, and other participants involved in gold transactions. XAUUSD spot quotations are formed through trading and dealer pricing rather than a single universal exchange. As a result, the latest value may differ slightly between data providers. A current gold price XAU USD search should therefore be understood as a request for a quotation from a specified source at a particular moment.
Spot XAUUSD quotations generally reflect transactions or indicative values for gold traded for near-term settlement. A spot gold price XAU/USD live feed may display those values as they change, depending on the provider. Futures contracts instead establish standardized obligations linked to a specified delivery month or settlement process. Physical gold purchases involve additional considerations such as manufacturing costs, dealer margins, transportation, storage, and insurance.
A gold futures contract may trade above or below the corresponding spot quotation because of financing costs, storage considerations, market expectations, and time remaining until expiration. Buyers of coins or bars may also encounter substantial premiums above reference market prices. Therefore, the XAU USD current price does not necessarily represent the total amount a retail customer would pay for a particular physical product.
XAUUSD quotations respond to a combination of monetary policy, economic conditions, financial market activity, and physical demand. Understanding these influences helps explain why the XAUUSD price can rise or fall even when there are no obvious changes in physical production.

The relationship between gold and the US dollar is an important consideration for market analysis. Because international gold quotations are commonly expressed in dollars, changes in the currency’s value can influence affordability for buyers using other currencies. A display labeled XAUUSD price live can reflect both shifts in demand and movements in the dollar. A stronger dollar may place downward pressure on gold demand, although this relationship is neither automatic nor consistent.
Interest rates also influence the relative appeal of holding a metal that does not generate interest payments. When inflation-adjusted bond yields increase, income-producing investments may become more attractive compared with gold. Falling real yields can reduce that opportunity cost. Traders evaluating the current XAUUSD price live should consider both currency performance and changes in expectations for Federal Reserve monetary policy.
Major US economic releases can influence XAUUSD through expectations for interest rates and financial market risk. Inflation reports, employment figures, consumer spending statistics, and measures of business activity frequently receive close attention. Their impact depends not only on the reported figures but also on how those figures compare with market expectations. The current XAUUSD gold price may react to those surprises and their implications for monetary policy.
Unexpectedly high inflation may strengthen interest in gold as a potential store of value. However, it may also encourage expectations of tighter monetary policy, higher bond yields, and a stronger dollar, potentially weighing on the metal. These competing effects mean that the XAUUSD response is not always straightforward. When evaluating an XAUUSD gold price current reading, analysts should assess the broader policy outlook instead of assuming that individual data releases have predictable results.
Gold has traditionally attracted interest during periods of financial instability and geopolitical uncertainty. Investors may increase allocations when they become concerned about currency stability, government debt, international conflict, or the performance of other asset classes. Nevertheless, the metal does not always rise during market stress, particularly when investors need liquidity or the dollar strengthens. A spot gold price XAU/USD live reading reflects market reactions, but cannot explain them on its own.
Investment flows through exchange-traded funds, bullion products, and institutional markets can also influence XAUUSD through demand for the underlying metal. Central banks may purchase gold as part of reserve diversification policies, while jewelry and industrial consumption contribute additional sources of demand. An assessment of the current gold price XAU/USD should consider these different participants because their objectives, transaction sizes, and investment horizons vary substantially.
XAUUSD trading takes place across several major financial centers, creating a market with extensive weekday coverage. An XAU USD live price feed may therefore update during much of the global working week. Although prices may update throughout much of the working week, trading schedules, liquidity conditions, and quotation availability depend on the particular venue or provider.

Activity during Asian market hours reflects developments in important regional financial centers, including Tokyo, Hong Kong, Shanghai, and Singapore. An XAU USD live price can respond to economic announcements, regional investment demand, currency movements, and overnight developments before European markets become fully active.
XAUUSD volatility may be comparatively limited during some Asian trading periods, but this pattern is not consistent. Important geopolitical events or major economic announcements can produce substantial movements at any time. Traders following intraday gold quotations should examine actual trading conditions rather than assuming a session will be quiet. Liquidity and spreads may also differ between providers, especially around local holidays and market transitions.
London plays an important role in the international bullion market. Institutional trading, over-the-counter transactions, and benchmark auctions make the city a significant center for precious metals pricing. XAUUSD activity may increase as European financial institutions begin their working day and respond to developments from the preceding Asian session. Comparing the current gold price XAU/USD with a London benchmark requires attention to when and how each value was established.
The LBMA Gold Price benchmark is established through auctions commencing at 10:30 a.m. and 3:00 p.m. London time on applicable business days. These benchmarks should not be confused with a continuously updating spot quotation. Users monitoring the XAUUSD price live throughout the day are viewing market data rather than the result of a new official benchmark auction after every price movement.
A display labeled gold price XAUUSD live can reflect new information during US trading hours, when economic releases, Federal Reserve communications, Treasury market activity, and exchange-traded gold products receive attention. The overlap between European and American business hours can create conditions with substantial participation and active price discovery.
Increased activity does not guarantee narrower spreads or more predictable movements. Unexpected announcements may cause prices to change rapidly even during otherwise liquid periods. Gold futures on COMEX also follow their own exchange schedules, including scheduled maintenance breaks. XAUUSD traders should consult the hours of their actual instrument rather than applying futures schedules automatically to every spot quotation or trading platform. A listing for current spot gold price XAU/USD live may therefore follow a different schedule from a particular futures contract.
A useful XAUUSD dashboard should combine an updated quotation with supporting information that helps visitors evaluate recent changes. Those searching for XAUUSD live data often want to understand the latest market movements and identify short-term trends. Charts and historical comparisons provide additional context, while the XAUUSD live price reflects the most recent available quotation. Reviewing this information together helps visitors assess how the market has changed and how the XAUUSD price compares with previous observations.
A dashboard labeled XAUUSD gold price current should identify its quotation timestamp and type. Other useful measurements include:
A dashboard offering a current spot gold price XAU/USD live display should distinguish executable quotations from reference values. It should also identify whether prices are delayed and explain how daily XAUUSD changes are calculated. Clear timestamps and source information help users avoid treating an outdated figure as a current market quotation.
XAUUSD analysis involves examining historical patterns while considering economic conditions and the behavior of market participants. Technical and fundamental analysis provide different perspectives, and neither can reliably predict every future movement.

A bullish XAUUSD trend generally features progressively higher peaks and higher lows, suggesting that buyers have maintained upward pressure over a period. A bearish trend shows the opposite pattern, with lower peaks and lower lows. Sideways conditions occur when prices fluctuate within a relatively established range. The current gold price XAU USD cannot establish a longer-term trend on its own.
Traders examining the XAUUSD chart may compare these patterns across several intervals to establish a broader market context. For example, a short intraday decline can occur within a longer upward trend without necessarily indicating a complete reversal. Understanding the distinction helps prevent short-term fluctuations from being interpreted as decisive changes in market direction. Trend identification is descriptive rather than predictive, and established patterns can reverse unexpectedly.
Consolidation occurs when XAU USD trades within a comparatively narrow area while market participants evaluate competing factors. These XAUUSD consolidations may follow strong movements or precede important economic announcements. Technical analysts often identify the upper and lower boundaries of these ranges as potential reference levels.
An XAUUSD breakout occurs when prices move beyond an established area of support or resistance. However, an initial movement outside a range does not guarantee continuation. Some breakouts reverse quickly, particularly when liquidity is limited or traders react to unexpected headlines. Analysts may examine closing prices, volatility, and subsequent price behavior for additional context. The XAUUSD live chart can illustrate these developments, but historical chart patterns cannot establish how future breakouts will perform.
XAUUSD technical analysis focuses on chart structure, price history, momentum, and volatility. Fundamental analysis examines economic conditions such as interest rates, inflation, currency performance, and investment demand. Combining these approaches may provide a more complete understanding of market developments than either method alone.
For example, a technical setup suggesting upward momentum may coincide with expectations of lower real interest rates. These factors could reinforce one another, but they do not eliminate uncertainty. An unexpected announcement can change the outlook immediately. Anyone reviewing a gold price XAUUSD live quotation should distinguish observable facts from assumptions and forecasts. Maintaining this distinction helps prevent temporary market movements from being presented as reliable predictions.
The interpretation of an XAU USD price depends partly on the period being examined. An XAUUSD movement that matters to an intraday trader may be insignificant for an investor evaluating long-term trends.
Short-term movements may be influenced by economic headlines, order flow, changing liquidity, and adjustments in speculative positioning. During active periods, a gold price XAUUSD live display can change repeatedly within minutes or seconds. These fluctuations create opportunities for analysis but also expose leveraged traders to rapid changes in account equity.
Those viewing a spot gold price XAU/USD live display should pay particular attention to spreads, volatility, and the timing of scheduled announcements. A sharp movement on a short chart does not necessarily indicate a lasting change in fundamental conditions. Short-term forecasts are especially sensitive to unexpected developments, and even historically successful technical patterns can fail when volatility increases.
Medium-term XAUUSD analysis generally examines developments over several days or weeks. Participants may focus on monetary policy expectations, changes in bond yields, currency trends, and the strength of investment demand. Daily and four-hour charts can help identify XAU USD gold price ranges and directional movements that are less obvious on shorter intervals.
An assessment of the current gold price XAU USD should consider whether recent changes are supported by broader economic developments. For example, a sustained change in inflation-adjusted yields may have a different significance from a brief reaction to a single headline. Analysts should also review conflicting evidence rather than selecting only the indicators that support a preferred market outlook.
Long-term XAUUSD analysis examines developments across months, years, or economic cycles. Structural demand from investors and central banks, monetary conditions, mining production, recycling, and global economic uncertainty can all influence the market over extended periods. An XAU USD current price reading captures only one point within that longer market history.
Historical trends can provide context, but previous performance does not establish future outcomes. Gold has experienced both prolonged advances and substantial declines, including periods when inflation-adjusted returns were disappointing. Investors reviewing the XAU USD gold price over longer horizons should also consider currency exposure, inflation, storage or product costs, and portfolio objectives. The importance of an individual daily movement diminishes when the relevant investment horizon spans several years.
Gold exposure is available through several financial instruments, each with different ownership arrangements and risk characteristics. Before entering a position, traders should understand the product being used, the transaction costs involved, and the potential consequences of leverage.
Investors may purchase physical bullion, use exchange-traded products, enter futures contracts, or trade derivatives referencing XAU USD quotations. Physical ownership involves storage, insurance, and dealer considerations, while exchange-traded products generally offer XAUUSD-linked exposure through securities with their own operating expenses and structures.
Futures involve standardized contracts with margin requirements and expiration provisions. Contracts for difference, where legally available, provide derivative exposure without ownership of the underlying metal and can involve leverage, financing charges, and counterparty risk. These products are not suitable for everyone. Before trading XAU/USD, participants should review the relevant documentation and determine whether the instrument’s structure fits their knowledge, financial situation, and objectives.
Trading costs affect the outcome of gold-related transactions. Depending on the product, expenses may include bid-ask spreads, brokerage commissions, overnight financing, exchange fees, conversion charges, or fund operating expenses. Some costs are visible when a trade is placed, while others accumulate during the holding period. A listing labeled current XAUUSD price live does not show all of these expenses.
A favorable entry price does not guarantee a profitable result once these expenses are considered. A strategy involving frequent transactions may be particularly sensitive to spread changes and execution costs. When comparing platforms showing XAUUSD quotations, traders should examine the total cost of participation rather than focusing exclusively on advertised spreads. Fee schedules, execution arrangements, and actual account terms can differ significantly between providers.
Position sizing determines the financial exposure associated with a trade. It should be considered alongside account capital, expected volatility, available margin, and the amount of loss the trader can reasonably withstand. Larger positions increase the financial effect of relatively small price movements. For a leveraged position, even a small change in the current XAUUSD gold price can have a substantial effect on account equity.
Leverage allows participants to control an exposure greater than their initial capital, magnifying both potential gains and losses. Depending on the product and applicable protections, losses may consume deposited funds rapidly and can exceed the initial amount committed. Traders using the XAUUSD live price should understand contract sizes, margin requirements, and liquidation procedures before opening positions. A stop-loss order may help manage exposure, but execution at the requested price is not guaranteed during gaps or rapidly changing conditions.
Accurate market information is essential for evaluating an XAU/USD live price. Even when two services display similar XAUUSD quotations, their underlying sources, update intervals, pricing methods, and access arrangements can differ.
An XAU USD price feed should identify the origin of its market data and provide sufficient information to establish whether the quotation is current. Some providers distribute continuously updated indicative values, while others display delayed prices or historical reference information. The difference matters when XAUUSD moves rapidly.
Search phrases such as current XAUUSD price live and current spot gold price XAU/USD live indicate a need for timely information, but the wording alone does not verify a feed’s accuracy. Users should compare timestamps, confirm the relevant timezone, and review whether the service reports bid, ask, or midpoint pricing. Transparent data policies are more useful than an unsupported claim of real-time accuracy.
Unlike a single exchange-listed stock, the broader spot gold market does not rely on one universal transaction venue. Different data providers can receive quotations from separate institutions, apply their own calculation methods, or update at different intervals. Consequently, modest variations between displayed values are not necessarily errors. A label reading XAUUSD live does not establish which institutions contribute to the quotation.
A platform labeled XAUUSD gold price current may show a midpoint, while another provider reports a bid quotation. Similarly, a result described as current gold price XAU/USD may reference a different moment or liquidity source. Users should investigate persistent or unusually large differences, particularly if the data will inform transactions. Price comparisons are meaningful only when the instruments, quotation types, and observation times are comparable.
Following the XAUUSD price provides a starting point for understanding developments in the international precious metals market. A live quotation identifies the latest available valuation, while chart analysis, economic information, and historical comparisons help place that figure in context.
Effective XAUUSD analysis requires more than watching prices rise or fall. Investors and traders should consider data quality, interest rate expectations, currency movements, liquidity, transaction costs, and the risks associated with their chosen instruments. Combining these elements supports a more balanced view of gold without assuming that any indicator or forecast can reliably predict future performance.
Short answers on how the XAUUSD quotation works.
Both notation formats represent the same general XAUUSD quotation against the US dollar. XAU identifies gold, and USD identifies the currency used for pricing. The slash is simply a naming convention. However, platforms may offer different instruments, spreads, and contract terms, so always check the exact product before placing trades.
XAUUSD quotations are available throughout most of the global trading week as activity moves between international financial centers. However, availability is not continuous everywhere. Weekends, holidays, maintenance breaks, and provider schedules can interrupt trading or updates. Check your platform's published hours to confirm when its specific gold instrument is available.
The XAUUSD quotation changes as supply, demand, and market expectations shift. Interest rates, US dollar strength, inflation reports, central bank purchases, geopolitical events, and investor sentiment can all influence prices. Short-term changes may also reflect liquidity and trading activity, so individual movements rarely have one clear explanation in isolation.
No. Live spot XAUUSD quotations provide a reference price per troy ounce, but physical coins, bars, and jewelry often cost more. Dealers may add premiums for manufacturing, distribution, insurance, and storage. Taxes and product purity also affect costs. Retail selling prices may differ considerably from a dealer's quoted purchase price.
Check the displayed timestamp, timezone, data source, and any stated delay. Confirm whether the quotation represents spot gold, futures, or a derivative, and whether it shows bid, ask, or midpoint pricing. Compare the market status with the provider's update policy. An XAUUSD label alone does not guarantee accuracy in practice.